Debt. It’s been a fairly topical subject in recent weeks. With The Hootsmon, revealing on March 10 that Scotland currently would have a “black hole of £15 billion”. And on March 24 revealed that it would have been only £10 billion on March 24 if we had voted YES instead of NO on Black Thursday!
 So, that means according to the voice of Unionism, that Scotland has lost another £5 billion (£5,000,000,000) by staying with the “delights” of London’s Tory austerity agenda in just 18 months.
But, debt, real or imagined, has been on my mind for another reason as well!
I had a conversation recently with one of the unionist Councillors here in Falkirk, yes on rare occasions we can have civil conversations. We were chatting about the GERS figures. Now to be fair this is not the brightest tool in the political box by their own admission and he was accepting the press interpretation that Scotland could not afford Independence with a £15 billion black hole.
When I asked how much he thought the UK “black hole” was, I received a blank look. The idea that the UK was seriously in hock had never entered the thought process. To be fair not much does.
Being in a generous mood I advised that the UK debt had been approx. £700 billion when the Tories came to power. At the time of Black Thursday, it had rocketed to approx. £1.4 trillion and now stood at approx. £1.7 trillion.
I also pointed out that the YES campaign offer was to take approx. £140 billion as Scotland’s share of the UK “National Debt” had we been using Sterling as a common currency.
By placing Scotland’s balance sheet alongside that of the UK I had rocked my colleague in a way he had never expected. That in turn got me thinking about the need to take on this whole issue. By exposing the frailty of the UK economy and the frightening scale of the UK debt burden we can perhaps unsettle some of the unthinking complacency which relies on the idea of the UK being an economic rock on which Scotland relies.
The simple truth is that the UK is an economic basket case. Their only real prospect of dealing with debt at those levels is through pretty high inflation rates. However, we have a Tory Government which cannot even manage to get inflation rising far less anything else in the economy!
So just how much of an economic basket case is the UK?
The UK “National Debt” is calculated as the total amount of money the British Government owes to the private sector and other purchasers of UK gilts.
In Dec 2015, Public sector net debt (ex. public sector banks) was £1,542.6 billion, equivalent to 81% of GDP. Source: [1. ONS public sector finances ] (page updated Jan 22nd 2016) Note the caveat they put on excluding public sector banks!
Other note is that a thousand billion is generally referred to as a trillion.
Budget deficit – annual borrowing
This is the amount the government has to borrow per year.
In 2013/14 net borrowing was forecast at £98.5bn or 5.7% of GDP (excluding public banks).
In 2014-15 net borrowing was forecast at £88 billion (4.9% of GDP).
The forecast for 2015-16 is net borrowing of £69.5bn or 3.7%.
So how can the deficit go down as the Tories claim but the debt mountain rises?
If annual borrowing falls from £98.5bn to £69.5bn, the annual deficit is lower. At the same time, the UK National Debt, (total debt), is still rising. In this case by 98.5 + 88.0 + 69.5 = £256 billion over those three years.
Unionism is simply unable to admit just how much of a Black Hole successive Governments have made. It’s much easier to blame the EU, or the “world recession” or laugh at the idea of trying to balance the books.
We could not expect George Osborne to do what John Swinney has to do each year. Come to think of it even every Council has to present a “Balanced Budget” each year by law. The sole exception is the mother of Parliaments, and how she has made the rest of us pay for that profligacy.
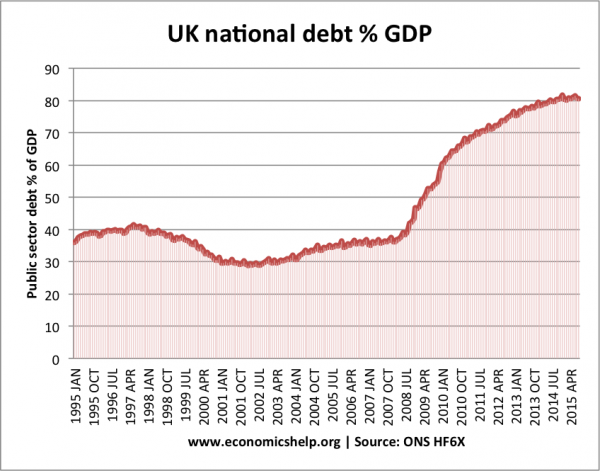
Perhaps the most useful measure of national debt is to look at it as a % of GDP.
![graph2]](https://scotsindependent.scot/wp-content/uploads/2016/04/graph2.png)
After a period of financial restraint, from mid 1990s, public sector debt as a % of GDP fell to 29% of GDP by 2002.
- From 2002 – 2007, national debt increased to 37% of GDP.
- 2008-2015 – public sector debt has increased sharply.
- 2008-13 recession, (lower tax receipts, higher spending on unemployment benefits) The recession particularly hit stamp duty (falling house prices) income tax and lower corporation tax.
- These cyclical factors have also exposed an underlying structural deficit. (deficit caused by spending greater than tax, and ignoring cyclical factors). It is these underlying structural deficit problems which are the real problem. Money has been invested in companies not for strategic long term growth but from year to year profit figures. Indeed, on too many occasions investors have barely looked from quarter to quarter.
- This has meant that companies cannot be seen to pursue sensible economic planning but instead satisfy the greed of the venture capital investment firms. The very people who, we are threatened, would leave if their bonuses were to be reduced.
- Financial bailout of Northern Rock, RBS, Lloyds and other banks.
- From 2011-2015, the pace of increase in the public sector debt has slowed due to the Government attempts to reduce the budget deficit. This is the Austerity Agenda in practice.
No Government can continue to ignore these factors. Re-write that. No sensible or competent Government can continue to ignore these factors.
Those conditions do not apply in the UK! We are forced to live with a Chancellor who has never hit an economic target to date, a Government which is riven by internal dissent and an “Opposition” split into five categories of “opposition” to its own leader!
Feeling Better Together Yet?
How much of an economic basket case is the UK? Let’s just say that if it was the fabled UKPLC, the liquidators would have been called in. The last time I looked it was illegal to continue to trade knowing you could not meet your financial obligations.